While messing with Bevel modifiers for the one-millionth time, I had the idea to create an add-on which could keep bevels in sync throughout a scene.
To make it more flexible, I call these “Smart Bevels” which can be used independently from regular bevels, though under the hood they are the same.
Basically, we create some global variables that store the bevel amount and segment count. The user may then add Smart Bevel modifiers to selected objects using the sidebar button or F3 menu. When the user clicks the “Apply Settings” button, the settings in the sidebar are propagated to each object with a Smart Bevel modifier. This can be done as many times as you want.
You can see it in action here:
As always, the code is open and freely available here.
If you have comments or suggestions, raise an issue on GitHub.
For all of the little projects I’ve done with voxels and Python, I’ve had to create some kind of custom representation of voxel entities on the back end. This was sloppy, but not really a problem until I started adding a bunch of custom features to voxygen (which I’ll be writing about soon). Every conversion, load, and render required conversions from one model to another, and they were beginning to get jumbled.
I needed a data model for Voxel data that is both flexible and fast, which could handle all of the most common tasks like reading and writing .vox files, but also open doors for complex custom operations.
Existing solution #1: py-vox-io uses a nifty data type called a namedtuple for Voxel representation. In this scheme, each Voxel object knows its own x, y, and z coordinates. The included coordinates could be handy, but it requires us to store an extra three ints per voxel, which quadruples the size of the model. On entities with hundreds of thousands of voxels, that’s a lot of fluff that we can probably cut out if we’re clever.
Existing solution #2: NumPy N-dimensional arrays (ndarrays). Fast and extremely memory efficient, there’s no denying NumPy arrays are an excellent choice for storing large numbers of objects of the same data type. However, ndarrays lack functionality specific to voxels. I wanted something fully featured so that I wouldn’t have to rewrite IO, conversions, or functions like flip.
VoxyPy is a high level data model for voxels. It has two main components: the Voxel class and the Entity class.
Voxel
Voxel is a small class representing one cell in an Entity.
Voxel colors are represented as indices from 0 to 255, where 0 means blank. These indices refer to actual RGB colors in a 1×255 .png file. So, for example, if the 10th pixel in the texture is red, then a voxel with value 10 will render as red.
It very thinly wraps a primitive int, allowing easy conversion and equality operations. Voxels and ints can be used interchangeably in most operations.
The Voxel class allows for a special addition/subtraction case: Adding 1 to 255 causes the color to wrap to 1 instead of 0. Similarly, subtracting 1 from 1 causes the color to go to 255 instead of 0. This is because 0 is blank in Voxel texture language, so if we wanted our color palette to repeat without a gap, we’d have to make a clever manual skip every time the index would be set to 0.
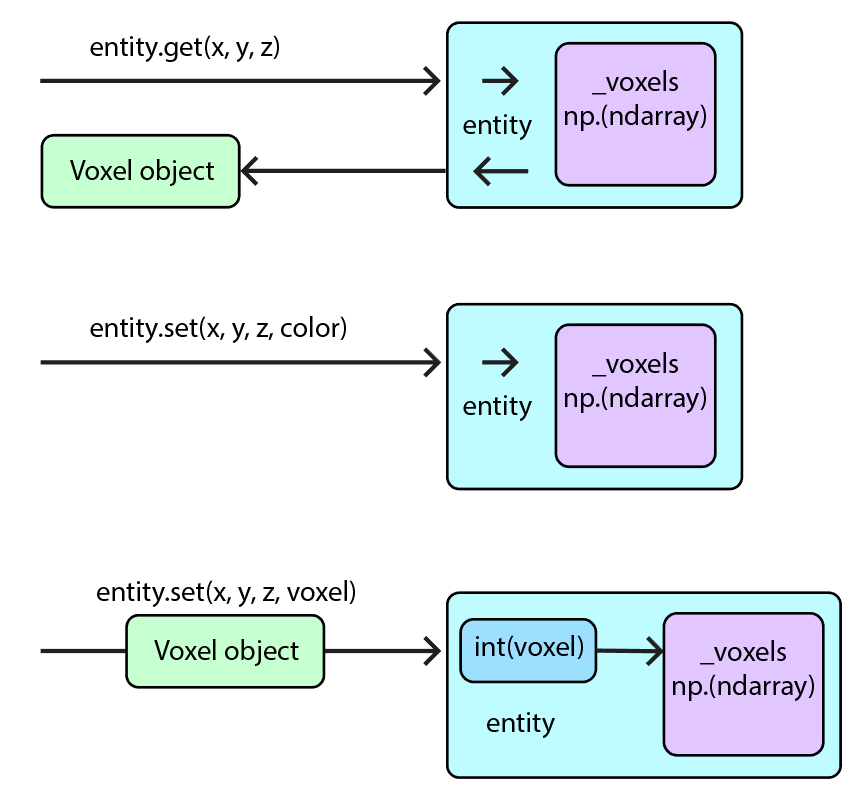
Entity
Entity basically functions as a space suit for a private ndarray called _voxels. It contains integer representations of each voxel within a model. By keeping _voxels private, we can manage user access, and also provide an efficient interface which gives and receives Voxel objects or integers on nearly even footing.
VoxyPy is currently available from PyPI/pip! Just install using
pip install voxypy
More documentation, including IO and example code, is located in the VoxyPy GitLab repo.
VoxyGen has had a lot of updates in the past few months, and I’ve been working on an extensive post detailing all the new features. But in the meantime, here’s a fun little update I added today that should yield some cool results when used correctly.
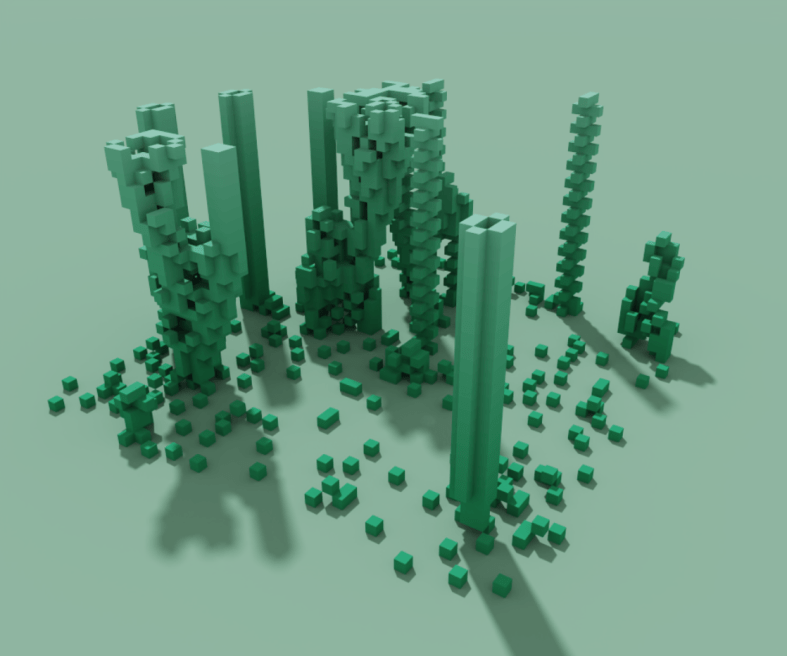
I’ve added Perlin noise to VoxyGen for commands that require seeds! Currently, this only includes spires and life, but I’m sure it will have plenty of uses in the future.
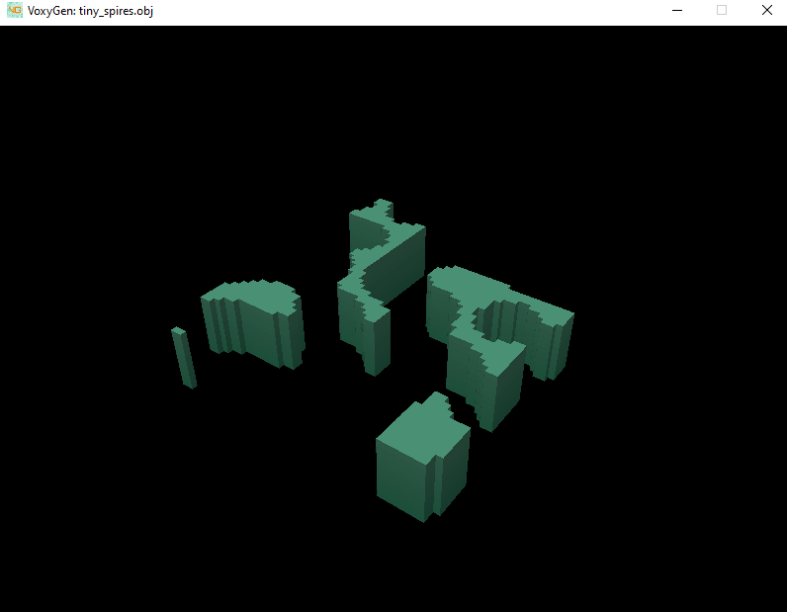
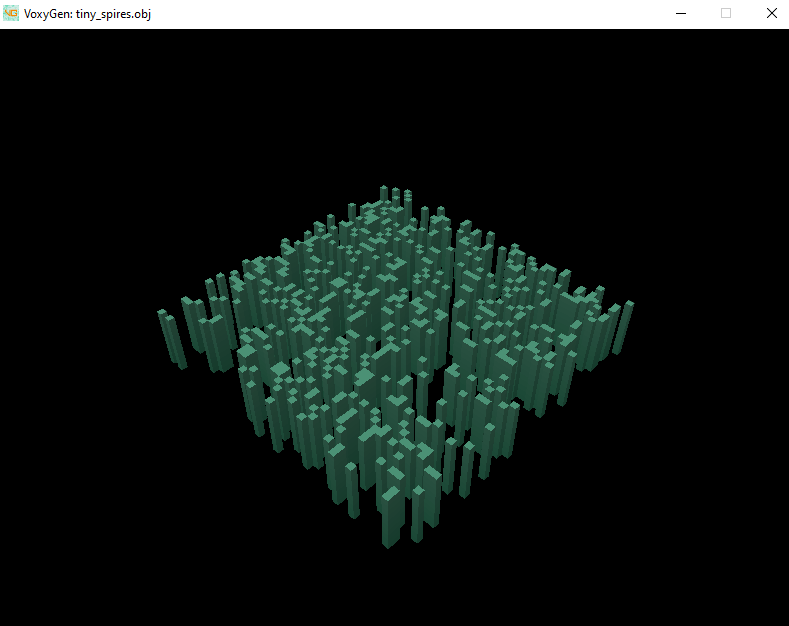
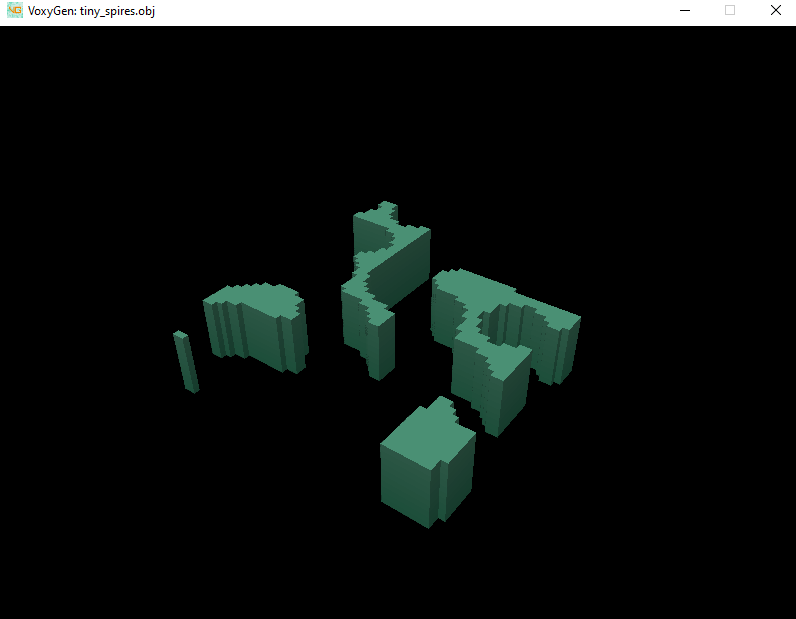
Previously, the only random distribution available was random (white) noise. Perlin allows for clumpier, more natural shapes. Here’s a comparison of the two:
White vs Perlin noise
(Including a preview of VoxyGen’s new built-in renderer)
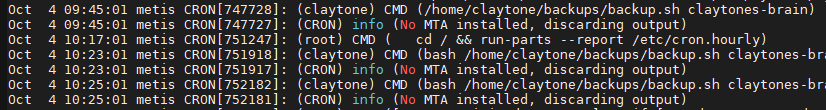
In yesterday’s post I created a crontab that saves a backup copy of my Obsidian vault to my server every night. This morning, however, I was met with this:
Can you spot the issue?
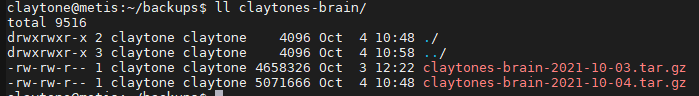
That column between username and date is the size of the file in bytes. Pretty odd that yesterday’s notes would be ~5mb, but today’s is only 45 bytes…
Notice also that the owner of today’s file is root, not claytone.
So, looks like we have some work to do.
Solving the ownership issue is simple; during my creation of the crontab yesterday, I used sudo crontab -e as instructed by Stack Overflow. However, this creates a crontab for root and not my user. This was a simple enough fix; I just had to run sudo crontab -e again and comment out the line from yesterday. Then, I set up a new job using crontab -e without sudo so that claytone would be creating all of the backups.
Troubleshooting the rest was a bit trickier.
When crontab jobs run, they send a copy of the output to the user’s mailbox on the server itself. However, I didn’t even have a mail server set up, so the output was discarded. I discovered this using cat /var/log/syslog | grep CRON | less
Oddly enough, I couldn’t even redirect the output of the cron job to a log file. It had to go through mail.
I did some googling and installed postfix as a mail sending service, and mailutils as a reading service. I was then able to view my cron logs by checking my inbox with the command mail.
Aha! When I moved the gdrive binary to /usr/local/bin, I didn’t realize the crontabs wouldn’t be able to see it on my PATH. I updated the script to include the full path to the gdrive command:
set -x

if [ "$#" -ne 1 ]; then
    echo "Invalid args. Please pass a file name to download."
    exit 1
fi

gdrive_loc='/usr/local/bin'
file_name=$1
file_loc='/home/claytone/backups/'$file_name
sed_expression='s/\(.*\)\s.*'$file_name'.*/\1/'
file_id=$($gdrive_loc/gdrive list --query "name contains '$file_name'" | grep $1 | sed -e $sed_expression )

$gdrive_loc/gdrive download --path $file_loc --recursive -f $file_id
tar -czf $file_loc/$file_name-$(date +'%Y-%m-%d').tar.gz $file_loc/$file_name

# Remove non-compressed version
rm -r $file_loc/$file_name

# If there are more than 10 days of history, remove the oldest file in the dir
if [ "$(ls -l $file_loc | wc -l)" -gt 10 ]; then
    oldest_file="$file_loc/$(ls -t $file_loc | tail -1)"
    echo "Removing $oldest_file"
    rm -r $oldest_file
fi
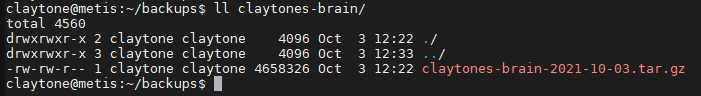
This time I tested the crontab by setting it to run very shortly after I closed the file. And presto, now it appears to work!
I recently started using Obsidian to bring some regulation to my large number of poorly organized notes. Of course, using multiple devices, I need to keep my vault in sync at all times. While you can pay for their proprietary cloud sync services, I’ve actually opted to create my own.
I wanted to create a backup system on Metis (my home server) in case I ever overwrite my Obsidian vault on Google Drive. This kind of thing has happened before with an encrypted password vault dropping a bunch of keys (rather than merging changes) when I make an edit from a separate place.
This will be a one-way sync that pulls down the vault from Google drive every night and archives it, leaving a copy that can’t be overwritten by the sync service.
I also want it to be generalized, so that I can make continuous backups of other files that frequently change on my Google Drive.
Setup
The first step is installing the Gdrive utility for Unix. This will allow me to interact with Google Drive from the command line.
I grabbed the gdrive_2.1.1_linux_386.tar.gz archive from their Releases page, unpacked it, and moved it to /usr/local/bin for execution. Don’t forget to reset your session.
claytone@metis:~$ wget https://github.com/prasmussen/gdrive/releases/download/2.1.1/gdrive_2.1.1_linux_386.tar.gz
claytone@metis:~$ tar -xvf gdrive_2.1.1_linux_386.tar.gz
claytone@metis:~$ sudo mv gdrive /usr/local/bin
claytone@metis:~$ source ~/.bashrc
claytone@metis:~$ ./gdrive list
Scripting
Setting up a bash script to pull the file from Drive is pretty easy.
However, I don’t want to keep tons of unnecessary copies over time. Ideally if I really mess up the sync, I should notice within 10 days. So, I’ll just drop the oldest file every day after the first 10 days.
Note that there is a bug in this script! Check out this post for the corrected version!
set -x

if [ "$#" -ne 1 ]; then
    echo "Invalid args. Please pass a file name to download."
    exit 1
fi

file_name=$1
file_loc='/home/claytone/backups/'$file_name
sed_expression='s/\(.*\)\s.*'$file_name'.*/\1/'
# Get file ID from searching gdrive
# TODO: if file not found, quit
file_id=$(gdrive list --query "name contains '$file_name'" | grep $1 | sed -e $sed_expression )

# Download and compress file
gdrive download --path $file_loc --recursive -f $file_id
tar -czf $file_loc/$file_name-$(date +'%Y-%m-%d').tar.gz $file_loc/$file_name

# Remove non-compressed version
rm -r $file_loc/$file_name

# If there are more than 10 days of history, remove the oldest file in the dir
if [ "$(ls -l $file_loc | wc -l)" -gt 10 ]; then
    oldest_file="$file_loc/$(ls -t $file_loc | tail -1)"
    echo "Removing $oldest_file"
    rm -r $oldest_file
fi
It appears to work!
Automation
You can create a repeating crontab job that runs at a certain time. In my case, I want the backups to trigger at 3 every morning. Run
sudo crontab -e
Note that using sudo will cause files created by your job to be owned by root! Don’t use sudo if you don’t want that!
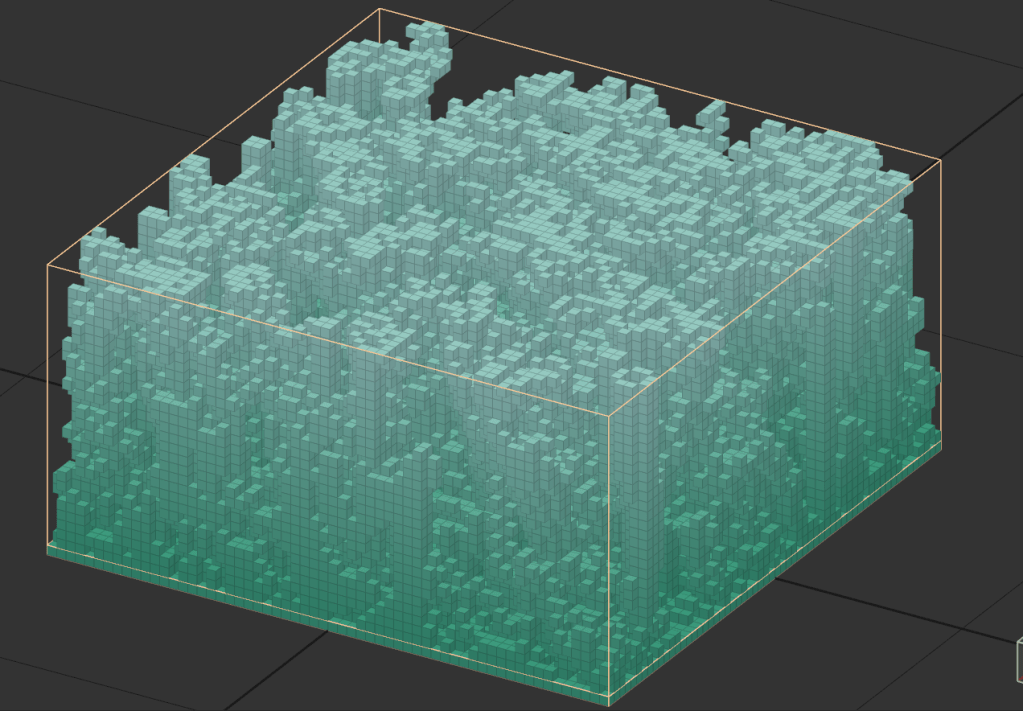
This actually makes a really cool organic texture when viewed from above and shadeless!
By switching the voxel shape to marching cubes, we get something a little less Minecraft-y
And finally, with the logo overlaid
Neat! This is actually a really good example of how quickly VoxyGen can churn out interesting results, especially when paired with a little creative manual input.
Last time I wrote a query to pivot the default UDisc scorecard data, which opened a lot of possibilities for analysis, but also made it a little more difficult to decide whether a game had been completed.
Marking games as “complete” means that you played all holes on the course in one round. For traditional golf, this is almost always 18. For disc golf, it varies. It is an important metric because it shows improvements in skill, but also stamina and consistency. Playing a 21 hole course takes at least an hour solo, and is pretty exhausting.
The value for completed has to be computed in parts. First, we count the number of holes where the score was not 0, indicating that the hole was played:
        select "PlayerName" as "name", "Date" as "dt",
        case when "Hole1"=0 then 0 else 1 end +
        case when "Hole2"=0 then 0 else 1 end +
        case when "Hole3"=0 then 0 else 1 end +
        case when "Hole4"=0 then 0 else 1 end +
        case when "Hole5"=0 then 0 else 1 end +
        case when "Hole6"=0 then 0 else 1 end +
        case when "Hole7"=0 then 0 else 1 end +
        case when "Hole8"=0 then 0 else 1 end +
        case when "Hole9"=0 then 0 else 1 end +
        case when "Hole10"=0 then 0 else 1 end +
        case when "Hole11"=0 then 0 else 1 end +
        case when "Hole12"=0 then 0 else 1 end +
        case when "Hole13"=0 then 0 else 1 end +
        case when "Hole14"=0 then 0 else 1 end +
        case when "Hole15"=0 then 0 else 1 end +
        case when "Hole16"=0 then 0 else 1 end +
        case when "Hole17"=0 then 0 else 1 end +
        case when "Hole18"=0 then 0 else 1 end +
        case when "Hole19"=0 then 0 else 1 end +
        case when "Hole20"=0 then 0 else 1 end +
        case when "Hole21"=0 then 0 else 1 end
        as "holes played"
        from "UDiscScorecards"
In PostgreSQL, CASE statements work the way IF statements do in traditional programming. This can be translated as "if HoleX==0 then 0 else 1"
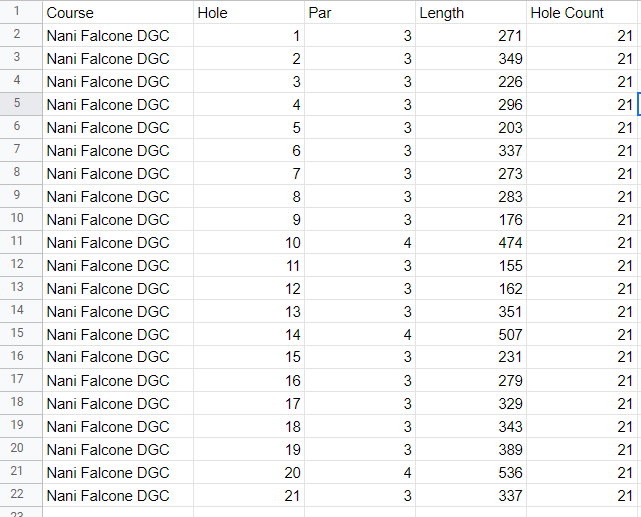
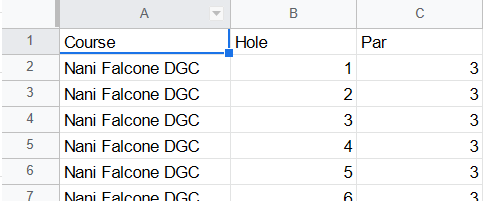
I’ve also appended a “Hole Count” column to the course data sheet:
Finally, we compare them and report the result
select "PlayerName", ..., "holes played"="Hole Count" as "Completed" from ...
The “x”=”y” returns true or false implicitly, so we don’t need to use a CASE statement here.
So, stitching it all together, the new query is:
select "PlayerName", "CourseName", "LayoutName", "Date", "hole", "score", "Par", "score" - "Par" as "Over", "holes played"="Hole Count" as "Completed"
from (
    select * from (
        select "PlayerName", "CourseName", "LayoutName", "Date", 1 as hole, "Hole1" as score from "UDiscScorecards" union
        select "PlayerName", "CourseName", "LayoutName", "Date", 2 as hole, "Hole2" as score from "UDiscScorecards" union
        select "PlayerName", "CourseName", "LayoutName", "Date", 3 as hole, "Hole3" as score from "UDiscScorecards" union
        select "PlayerName", "CourseName", "LayoutName", "Date", 4 as hole, "Hole4" as score from "UDiscScorecards" union
        select "PlayerName", "CourseName", "LayoutName", "Date", 5 as hole, "Hole5" as score from "UDiscScorecards" union
        select "PlayerName", "CourseName", "LayoutName", "Date", 6 as hole, "Hole6" as score from "UDiscScorecards" union
        select "PlayerName", "CourseName", "LayoutName", "Date", 7 as hole, "Hole7" as score from "UDiscScorecards" union
        select "PlayerName", "CourseName", "LayoutName", "Date", 8 as hole, "Hole8" as score from "UDiscScorecards" union
        select "PlayerName", "CourseName", "LayoutName", "Date", 9 as hole, "Hole9" as score from "UDiscScorecards" union
        select "PlayerName", "CourseName", "LayoutName", "Date", 10 as hole, "Hole10" as score from "UDiscScorecards" union
        select "PlayerName", "CourseName", "LayoutName", "Date", 11 as hole, "Hole11" as score from "UDiscScorecards" union
        select "PlayerName", "CourseName", "LayoutName", "Date", 12 as hole, "Hole12" as score from "UDiscScorecards" union
        select "PlayerName", "CourseName", "LayoutName", "Date", 13 as hole, "Hole13" as score from "UDiscScorecards" union
        select "PlayerName", "CourseName", "LayoutName", "Date", 14 as hole, "Hole14" as score from "UDiscScorecards" union
        select "PlayerName", "CourseName", "LayoutName", "Date", 15 as hole, "Hole15" as score from "UDiscScorecards" union
        select "PlayerName", "CourseName", "LayoutName", "Date", 16 as hole, "Hole16" as score from "UDiscScorecards" union
        select "PlayerName", "CourseName", "LayoutName", "Date", 17 as hole, "Hole17" as score from "UDiscScorecards" union
        select "PlayerName", "CourseName", "LayoutName", "Date", 18 as hole, "Hole18" as score from "UDiscScorecards" union
        select "PlayerName", "CourseName", "LayoutName", "Date", 19 as hole, "Hole19" as score from "UDiscScorecards" union
        select "PlayerName", "CourseName", "LayoutName", "Date", 20 as hole, "Hole20" as score from "UDiscScorecards" union
        select "PlayerName", "CourseName", "LayoutName", "Date", 21 as hole, "Hole21" as score from "UDiscScorecards"
  ) pivoted
  left join (
        select "PlayerName" as "name", "Date" as "dt",
        case when "Hole1"=0 then 0 else 1 end +
        case when "Hole2"=0 then 0 else 1 end +
        case when "Hole3"=0 then 0 else 1 end +
        case when "Hole4"=0 then 0 else 1 end +
        case when "Hole5"=0 then 0 else 1 end +
        case when "Hole6"=0 then 0 else 1 end +
        case when "Hole7"=0 then 0 else 1 end +
        case when "Hole8"=0 then 0 else 1 end +
        case when "Hole9"=0 then 0 else 1 end +
        case when "Hole10"=0 then 0 else 1 end +
        case when "Hole11"=0 then 0 else 1 end +
        case when "Hole12"=0 then 0 else 1 end +
        case when "Hole13"=0 then 0 else 1 end +
        case when "Hole14"=0 then 0 else 1 end +
        case when "Hole15"=0 then 0 else 1 end +
        case when "Hole16"=0 then 0 else 1 end +
        case when "Hole17"=0 then 0 else 1 end +
        case when "Hole18"=0 then 0 else 1 end +
        case when "Hole19"=0 then 0 else 1 end +
        case when "Hole20"=0 then 0 else 1 end +
        case when "Hole21"=0 then 0 else 1 end
        as "holes played"
        from "UDiscScorecards"
  ) completed
  on "pivoted"."PlayerName" = "completed"."name"
  and "pivoted"."Date" = "completed"."dt"
  where "score" <> 0
  and "PlayerName" <> 'Par'
) cards
left JOIN (
    select * from "CoursePars"
) pars
on "cards"."hole" = "pars"."Hole"
and "cards"."CourseName" like "pars"."Course"
Definitely a mouthful, but pretty straightforward. If you know a more elegant way, leave a comment below.
Anyway, with the boring stuff out of the way, lets get down to the pretty charts.
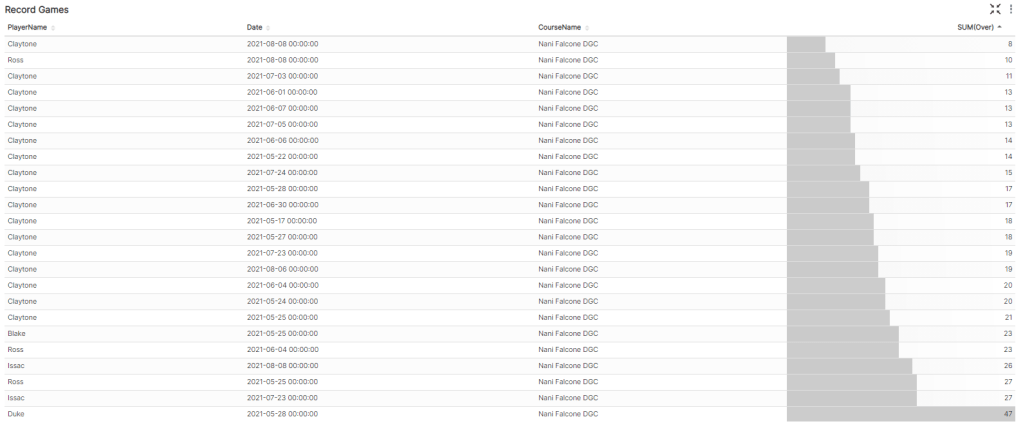
The obvious first thing to check is how my best games have changed over time.
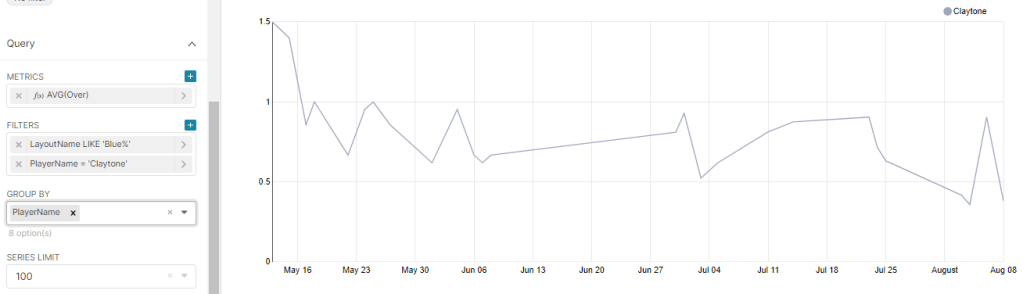
There seems to be a trend downward, although not a very quick one. The downward trend is more apparent in another useful metric: average throws over par, plotted against time. Note that this viz includes all holes played, regardless of game completion.
These trends are also a little obscured by the outlier bad game I had on August 6th, where I forgot my putter and had to use the wrong disc.
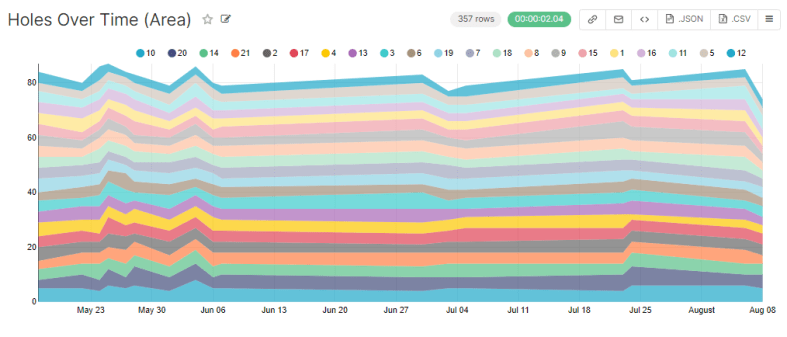
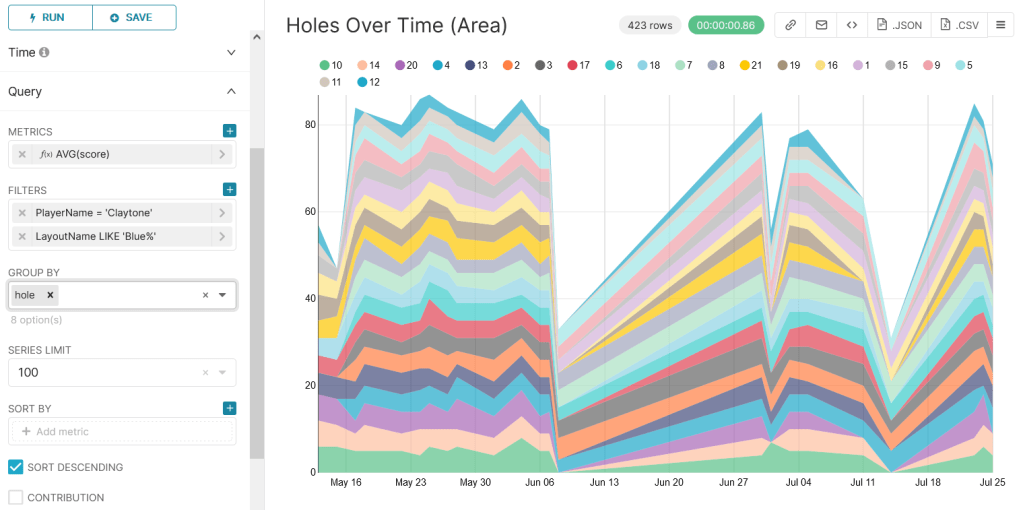
While we’re at it, lets revisit the flashy area chart from last post, where the width of each stripe represents the number of throws taken on that hole:
This is flashy and colorful, but we’re more concerned with problematic holes. Lets change width from number of throws to number of throws over par.
Awesome. This shows about what you’d expect. An interesting thing to notice is that while I’ve gotten better at hole 1, I’ve actually gotten worse at 9 (pale orange).
This might be because 9 is heavily wooded and honestly kind of a crapshoot… but the trend seems a little too strong. Furthermore, I changed my strategy probably around early July. Instead of attempting to weave my disc through the woods, I started tomahawking it over the tree tops. The data says this strat may not be working. Neat.
Last thing, lets make a leaderboard for completed games.
I play way more often than my friends, so the data might be skewed, aha.
Also shoutout to Duke for having the courage to play blue tees on his first game.
That’s all for now. Next time I’ll try to correlate hole length with average throws over par.
Sorry for the clickbait title, it was low hanging fruit.
Today I’ll be adding Conway’s Game of Life to VoxyGen. If you’re not familiar, it is a zero-player simulation “game” with simple rules, but it has been studied extensively by mathematicians and scientists for decades.
“Life” takes place on a two dimensional grid. Each “turn”, all of the “cells” are evaluated to generate the next iteration. This can repeat indefinitely.
Here’s an example of a famous structure, dubbed Gosper’s Glider Gun, that creates knots of traveling cells:
Life operates by a simple set of rules:
If a cell is ON and has fewer than two neighbors that are ON, it turns OFF
If a cell is ON and has either two or three neighbors that are ON, it remains ON.
If a cell is ON and has more than three neighbors that are ON, it turns OFF.
If a cell is OFF and has exactly three neighbors that are ON, it turns ON.
From this, there are many possibilities for patterns and structures, with interesting new ones being discovered all the time.
The implementation is pretty straightforward:
def life_layer(old_layer, color):
    x_size = len(old_layer)
    y_size = len(old_layer[0])
    new_layer = np.zeros((x_size, y_size), dtype=int)
    for x in range(x_size):
        for y in range(y_size):
            neighbors = count_neighbors(old_layer, x, y)
            if old_layer[x][y] != 0:  # alive
                if neighbors < 2:
                    new_layer[x][y] = 0
                elif neighbors == 2 or neighbors == 3:
                    new_layer[x][y] = color
                elif neighbors > 3:
                    new_layer[x][y] = 0
            elif neighbors == 3:
                new_layer[x][y] = color
    return new_layer
Wow, that’s pretty interesting. Right away, we can see some of the classic formations.
Front and center, you can see a static beehive:
Way off to the right, you can see a simple blinker:
And a bit to the left you can see the formation of a stable block:
There’s a lot of creative potential here for injecting some nice, organic randomness into your generated models.
What about some fun stuff? Lets make a glider shape, which you can see being emitted from Gosper’s Gun earlier in this post. This shape will repeat itself forever, flying away into the void.
Cool, but lets try a pulsar
Sweet. The pattern injection code is against the spirit of generative art… but in the spirit of the game of Life, I’ll let it slide.
Next time I’ll experiment with further parameterizing the game to allow greater flexibility in rules.
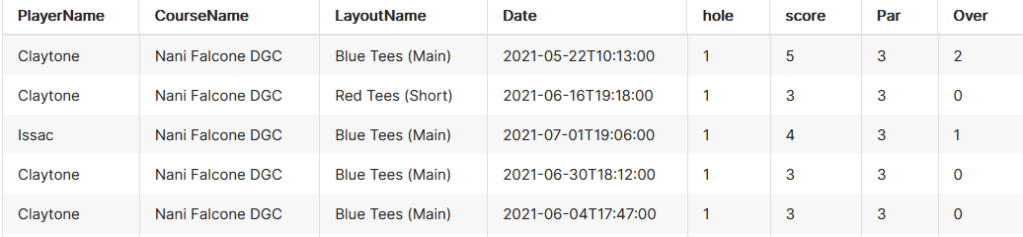
In my last post I talked about the process for importing UDisc data into Apache Superset for some advanced analytics. Unfortunately, with the data formatted as it was, I couldn’t get very meaningful insights.
Here’s the default layout for CSVs exported from the UDisc app.
Each row corresponds to a game. You’ll notice that there are some issues here.
“Par” is listed as a player and must always be filtered out.
“Total” corresponds to the total number of throws in a game. This isn’t useful because it is common to not play all 21 holes.
“+/-” is a terrible name for a column, and refers to the number of throws over/under par for that game. This is not useful because, again, it doesn’t take incomplete games into account.
Each hole has its own column. This means comparing them (for example, finding one’s weakest hole) requires a really large IF statement.
To solve these issues, I wrote a simple query to transpose the table.
select "PlayerName", "CourseName", "LayoutName", "Date", "hole", "score", "Par", "score" - "Par" as "Over" from
(
select "PlayerName", "CourseName", "LayoutName", "Date", 1 as hole, "Hole1" as score from "UDiscScorecards" union
select "PlayerName", "CourseName", "LayoutName", "Date", 2 as hole, "Hole2" as score from "UDiscScorecards" union
select "PlayerName", "CourseName", "LayoutName", "Date", 3 as hole, "Hole3" as score from "UDiscScorecards" union
select "PlayerName", "CourseName", "LayoutName", "Date", 4 as hole, "Hole4" as score from "UDiscScorecards" union
select "PlayerName", "CourseName", "LayoutName", "Date", 5 as hole, "Hole5" as score from "UDiscScorecards" union
select "PlayerName", "CourseName", "LayoutName", "Date", 6 as hole, "Hole6" as score from "UDiscScorecards" union
select "PlayerName", "CourseName", "LayoutName", "Date", 7 as hole, "Hole7" as score from "UDiscScorecards" union
select "PlayerName", "CourseName", "LayoutName", "Date", 8 as hole, "Hole8" as score from "UDiscScorecards" union
select "PlayerName", "CourseName", "LayoutName", "Date", 9 as hole, "Hole9" as score from "UDiscScorecards" union
select "PlayerName", "CourseName", "LayoutName", "Date", 10 as hole, "Hole10" as score from "UDiscScorecards" union
select "PlayerName", "CourseName", "LayoutName", "Date", 11 as hole, "Hole11" as score from "UDiscScorecards" union
select "PlayerName", "CourseName", "LayoutName", "Date", 12 as hole, "Hole12" as score from "UDiscScorecards" union
select "PlayerName", "CourseName", "LayoutName", "Date", 13 as hole, "Hole13" as score from "UDiscScorecards" union
select "PlayerName", "CourseName", "LayoutName", "Date", 14 as hole, "Hole14" as score from "UDiscScorecards" union
select "PlayerName", "CourseName", "LayoutName", "Date", 15 as hole, "Hole15" as score from "UDiscScorecards" union
select "PlayerName", "CourseName", "LayoutName", "Date", 16 as hole, "Hole16" as score from "UDiscScorecards" union
select "PlayerName", "CourseName", "LayoutName", "Date", 17 as hole, "Hole17" as score from "UDiscScorecards" union
select "PlayerName", "CourseName", "LayoutName", "Date", 18 as hole, "Hole18" as score from "UDiscScorecards" union
select "PlayerName", "CourseName", "LayoutName", "Date", 19 as hole, "Hole19" as score from "UDiscScorecards" union
select "PlayerName", "CourseName", "LayoutName", "Date", 20 as hole, "Hole20" as score from "UDiscScorecards" union
select "PlayerName", "CourseName", "LayoutName", "Date", 21 as hole, "Hole21" as score from "UDiscScorecards"
) cards left JOIN
( select * from "CoursePars" ) pars
on "cards"."hole" = "pars"."Hole"
and "cards"."CourseName" like "pars"."Course"
where "score" <> 0 and
"PlayerName" <> 'Par'
This shapes the data like so:
Now each row corresponds to a hole. Lets break it down.
Removing Par is easy enough, we must simply add the clause “PlayerName” <> ‘Par’
Total is now removed. If it is required, it can easily be calculated by summing “Score” and grouping on “PlayerName” and “Date”
In order to calculate over/under (formerly known as “+/-“) I created another table that could be joined to this one, titled “CoursePars”. After joining, we do “score” – “Par” and report that as “Over”. “CoursePars” looks like this:
4. By transposing the hole data and making it numeric, it’s now much easier to draw comparisons between holes. In the future, I’ll even append “Length” to the holes to illustrate how distance changes a hole’s difficulty.
Finally, for the fun stuff.
The most obvious metric is finding the holes I have the most trouble with, and the first few are honestly not that surprising.
Coming in first at a whopping 1.28 average throws over par is the bane of my existence, hole 10. This bad boy is one of the longest on the course at 474 feet, which doesn’t even account for the sharp left turn at about 300 feet. Trying to cut the corner (or accidentally putting it left) leaves you in thick, unforgiving brush.
The next few aren’t surprising either: baskets on unforgiving hill sides, across overgrown creeks, and through thick forests.
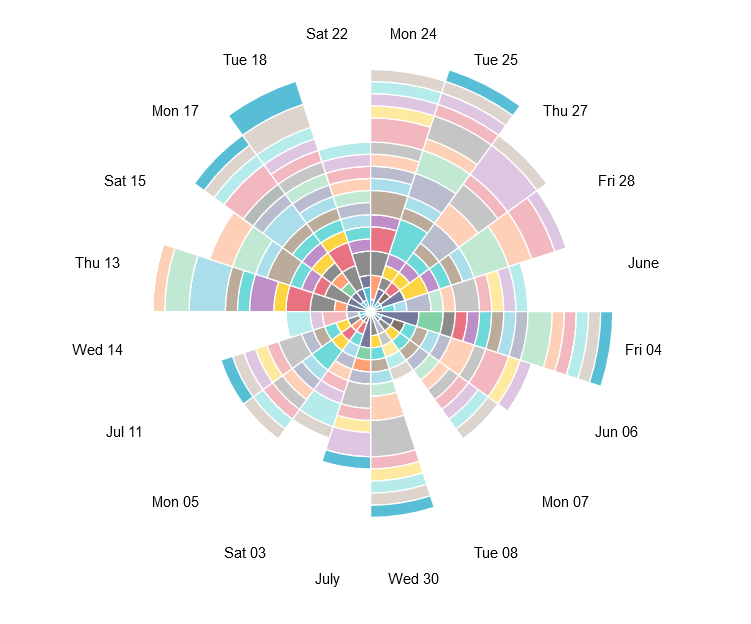
I’d like to experiment with weirder vizzes like the following Nightingale-Rose chart, but the “angle” axis is locked so that it can only be used with temporal fields for some reason. The flexibility of charts seems to be a key advantage that Tableau holds over Superset.
As such, this chart is not useful at all, but is nonetheless very cool looking.
Here’s a much more useful version, showing average throws per hole using area under lines.
A key downfall of this chart, however, is that it isn’t normalized for full games. This is really obvious with the dive on the June 8th game where I was only able to play 6 holes because it started raining.
Next time I’ll add hole length stats to see how it impacts difficulty, and also create a calculation to indicate completed versus partial games.
I started a Blogspot a few months ago as a means for documenting all of my experiments, side projects, and lessons learned.
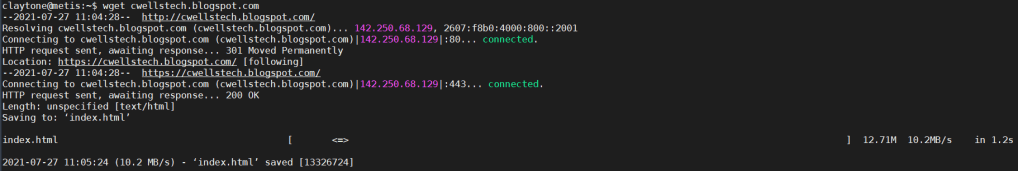
Unfortunately, it looks like my free site has completely given up. I’m unable to load the site whatsoever, and when editing my posts, all of the images are gone. Amazing.
I’m not even able to use wget to download the site and hang onto my screenshots.
And to top it all off, Blogger has
No support email
Deactivated social media accounts
Incomplete documentation
As a last-ditch effort, I attempted to use my blog settings > manage > back up content to download the site, but the download failed.
Soooo it looks like I’m starting fresh on WordPress. Probably should have done that in the first place, but oh well.
Happy coding, all.
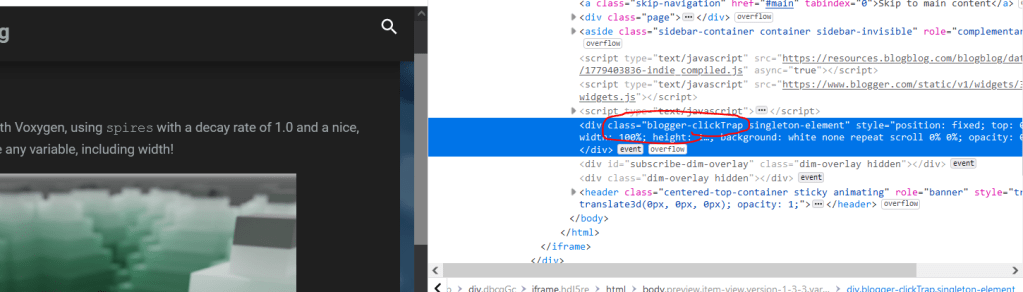
EDIT: I’ve figured out how to rescue my progress pictures. On the Blogger admin view, choose Preview and wait a bit.
Eventually, the preview version of your post will pop up. Right click your desired image, and choose Inspect (on Chrome I think it’s Inspect Element).
Delete the Blogger ClickTrap div if this is the first image you’re saving. Then right click your image, hit Inspect again.
Ctrl+click on the image link, then ctrl+s to save it.