Disc Golf Analytics: Completed Games

Last time I wrote a query to pivot the default UDisc scorecard data, which opened a lot of possibilities for analysis, but also made it a little more difficult to decide whether a game had been completed.

Marking games as “complete” means that you played all holes on the course in one round. For traditional golf, this is almost always 18. For disc golf, it varies. It is an important metric because it shows improvements in skill, but also stamina and consistency. Playing a 21 hole course takes at least an hour solo, and is pretty exhausting.

The value for completed has to be computed in parts. First, we count the number of holes where the score was not 0, indicating that the hole was played:

        select "PlayerName" as "name", "Date" as "dt", 
        case when "Hole1"=0 then 0 else 1 end + 
        case when "Hole2"=0 then 0 else 1 end +
        case when "Hole3"=0 then 0 else 1 end +
        case when "Hole4"=0 then 0 else 1 end +
        case when "Hole5"=0 then 0 else 1 end +
        case when "Hole6"=0 then 0 else 1 end +
        case when "Hole7"=0 then 0 else 1 end +
        case when "Hole8"=0 then 0 else 1 end +
        case when "Hole9"=0 then 0 else 1 end +
        case when "Hole10"=0 then 0 else 1 end +
        case when "Hole11"=0 then 0 else 1 end +
        case when "Hole12"=0 then 0 else 1 end +
        case when "Hole13"=0 then 0 else 1 end +
        case when "Hole14"=0 then 0 else 1 end +
        case when "Hole15"=0 then 0 else 1 end +
        case when "Hole16"=0 then 0 else 1 end +
        case when "Hole17"=0 then 0 else 1 end +
        case when "Hole18"=0 then 0 else 1 end +
        case when "Hole19"=0 then 0 else 1 end +
        case when "Hole20"=0 then 0 else 1 end +
        case when "Hole21"=0 then 0 else 1 end
        as "holes played"
        from "UDiscScorecards"

In PostgreSQL, CASE statements work the way IF statements do in traditional programming. This can be translated as "if HoleX==0 then 0 else 1"

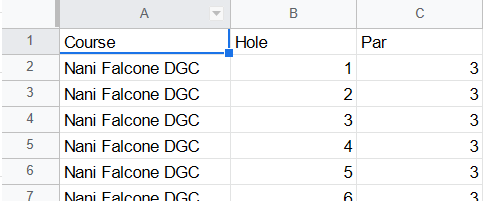
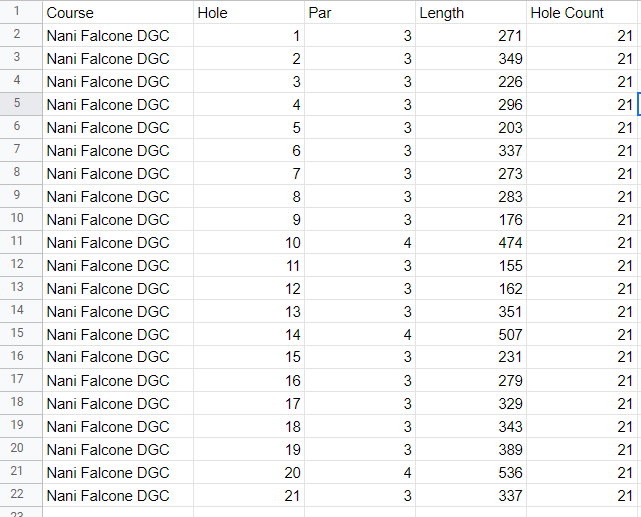
I’ve also appended a “Hole Count” column to the course data sheet:

Finally, we compare them and report the result

select "PlayerName", ...,  "holes played"="Hole Count" as "Completed" from ...

The “x”=”y” returns true or false implicitly, so we don’t need to use a CASE statement here.

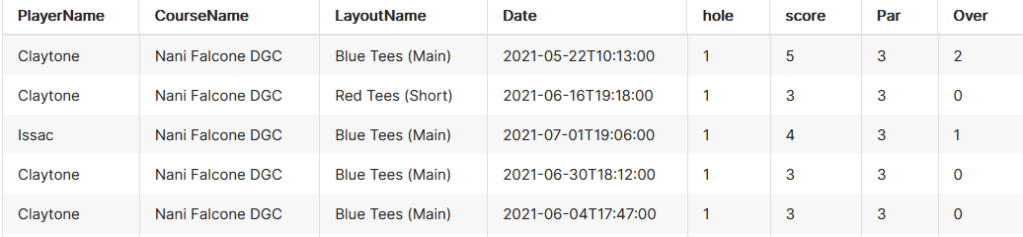
So, stitching it all together, the new query is:

select "PlayerName", "CourseName", "LayoutName", "Date", "hole", "score", "Par", "score" - "Par" as "Over", "holes played"="Hole Count" as "Completed" 
from (
    select * from (
        select "PlayerName", "CourseName", "LayoutName", "Date", 1 as hole, "Hole1" as score from "UDiscScorecards" union
        select "PlayerName", "CourseName", "LayoutName", "Date", 2 as hole, "Hole2" as score from "UDiscScorecards" union
        select "PlayerName", "CourseName", "LayoutName", "Date", 3 as hole, "Hole3" as score from "UDiscScorecards" union
        select "PlayerName", "CourseName", "LayoutName", "Date", 4 as hole, "Hole4" as score from "UDiscScorecards" union
        select "PlayerName", "CourseName", "LayoutName", "Date", 5 as hole, "Hole5" as score from "UDiscScorecards" union
        select "PlayerName", "CourseName", "LayoutName", "Date", 6 as hole, "Hole6" as score from "UDiscScorecards" union
        select "PlayerName", "CourseName", "LayoutName", "Date", 7 as hole, "Hole7" as score from "UDiscScorecards" union
        select "PlayerName", "CourseName", "LayoutName", "Date", 8 as hole, "Hole8" as score from "UDiscScorecards" union
        select "PlayerName", "CourseName", "LayoutName", "Date", 9 as hole, "Hole9" as score from "UDiscScorecards" union
        select "PlayerName", "CourseName", "LayoutName", "Date", 10 as hole, "Hole10" as score from "UDiscScorecards" union
        select "PlayerName", "CourseName", "LayoutName", "Date", 11 as hole, "Hole11" as score from "UDiscScorecards" union
        select "PlayerName", "CourseName", "LayoutName", "Date", 12 as hole, "Hole12" as score from "UDiscScorecards" union
        select "PlayerName", "CourseName", "LayoutName", "Date", 13 as hole, "Hole13" as score from "UDiscScorecards" union
        select "PlayerName", "CourseName", "LayoutName", "Date", 14 as hole, "Hole14" as score from "UDiscScorecards" union
        select "PlayerName", "CourseName", "LayoutName", "Date", 15 as hole, "Hole15" as score from "UDiscScorecards" union
        select "PlayerName", "CourseName", "LayoutName", "Date", 16 as hole, "Hole16" as score from "UDiscScorecards" union
        select "PlayerName", "CourseName", "LayoutName", "Date", 17 as hole, "Hole17" as score from "UDiscScorecards" union
        select "PlayerName", "CourseName", "LayoutName", "Date", 18 as hole, "Hole18" as score from "UDiscScorecards" union
        select "PlayerName", "CourseName", "LayoutName", "Date", 19 as hole, "Hole19" as score from "UDiscScorecards" union
        select "PlayerName", "CourseName", "LayoutName", "Date", 20 as hole, "Hole20" as score from "UDiscScorecards" union
        select "PlayerName", "CourseName", "LayoutName", "Date", 21 as hole, "Hole21" as score from "UDiscScorecards" 
  ) pivoted 
  left join (
        select "PlayerName" as "name", "Date" as "dt", 
        case when "Hole1"=0 then 0 else 1 end + 
        case when "Hole2"=0 then 0 else 1 end +
        case when "Hole3"=0 then 0 else 1 end +
        case when "Hole4"=0 then 0 else 1 end +
        case when "Hole5"=0 then 0 else 1 end +
        case when "Hole6"=0 then 0 else 1 end +
        case when "Hole7"=0 then 0 else 1 end +
        case when "Hole8"=0 then 0 else 1 end +
        case when "Hole9"=0 then 0 else 1 end +
        case when "Hole10"=0 then 0 else 1 end +
        case when "Hole11"=0 then 0 else 1 end +
        case when "Hole12"=0 then 0 else 1 end +
        case when "Hole13"=0 then 0 else 1 end +
        case when "Hole14"=0 then 0 else 1 end +
        case when "Hole15"=0 then 0 else 1 end +
        case when "Hole16"=0 then 0 else 1 end +
        case when "Hole17"=0 then 0 else 1 end +
        case when "Hole18"=0 then 0 else 1 end +
        case when "Hole19"=0 then 0 else 1 end +
        case when "Hole20"=0 then 0 else 1 end +
        case when "Hole21"=0 then 0 else 1 end
        as "holes played"
        from "UDiscScorecards"
  ) completed 
  on "pivoted"."PlayerName" = "completed"."name"
  and "pivoted"."Date" = "completed"."dt"
  where "score" <> 0
  and "PlayerName" <> 'Par'
) cards 
left JOIN ( 
    select * from "CoursePars" 
) pars
on "cards"."hole" = "pars"."Hole"
and "cards"."CourseName" like "pars"."Course"

Definitely a mouthful, but pretty straightforward. If you know a more elegant way, leave a comment below.

Anyway, with the boring stuff out of the way, lets get down to the pretty charts.

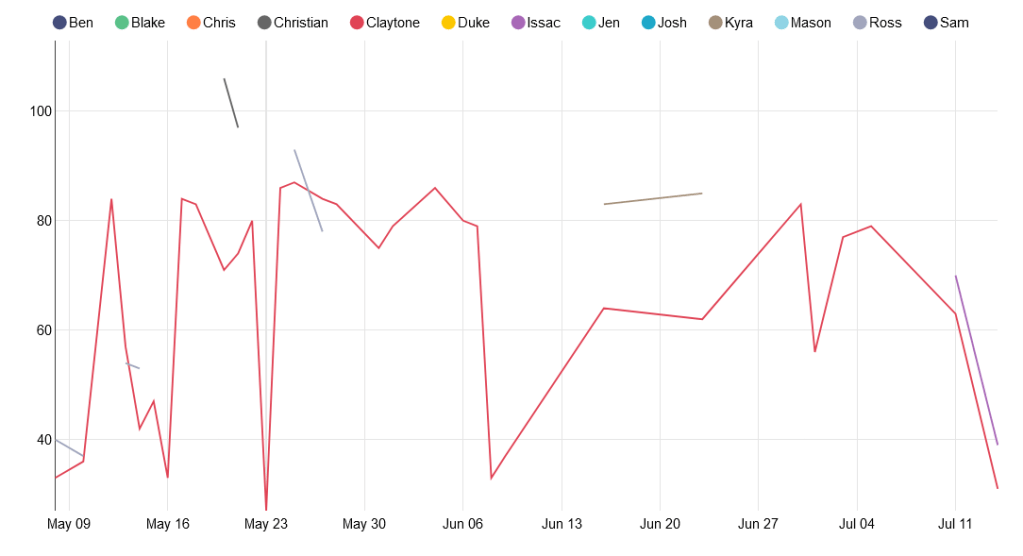
The obvious first thing to check is how my best games have changed over time.

There seems to be a trend downward, although not a very quick one. The downward trend is more apparent in another useful metric: average throws over par, plotted against time. Note that this viz includes all holes played, regardless of game completion.

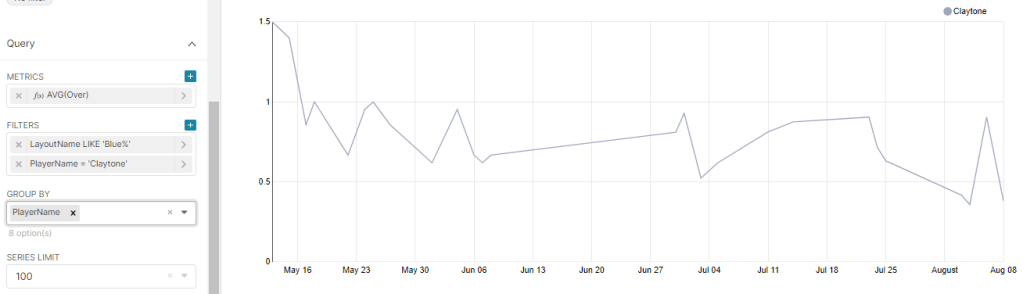
These trends are also a little obscured by the outlier bad game I had on August 6th, where I forgot my putter and had to use the wrong disc.

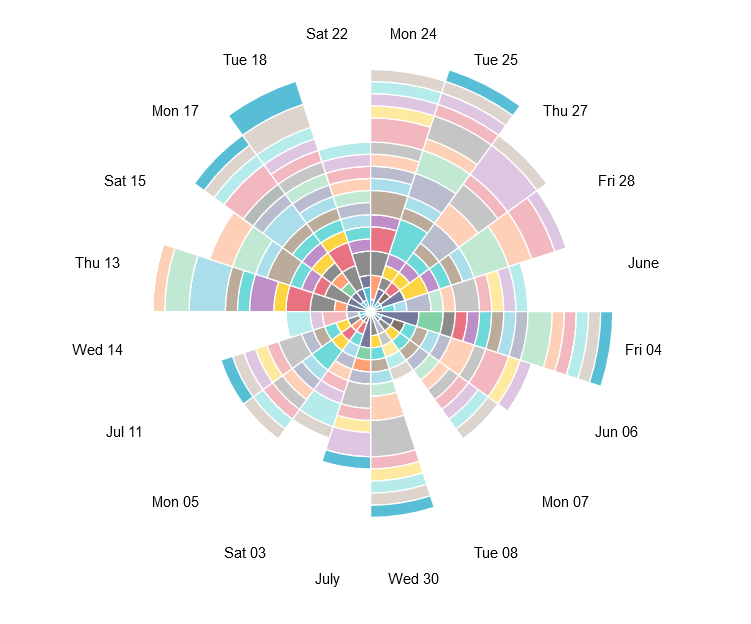
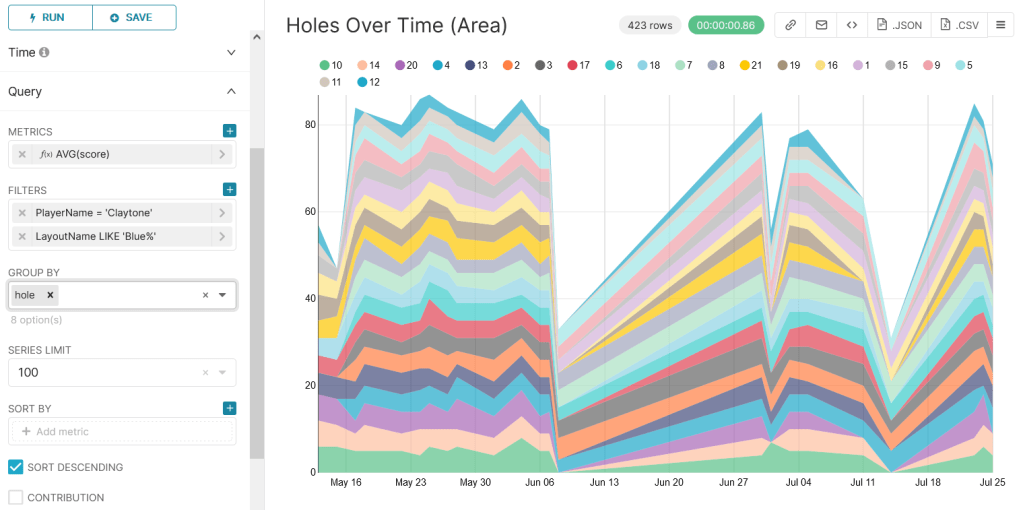
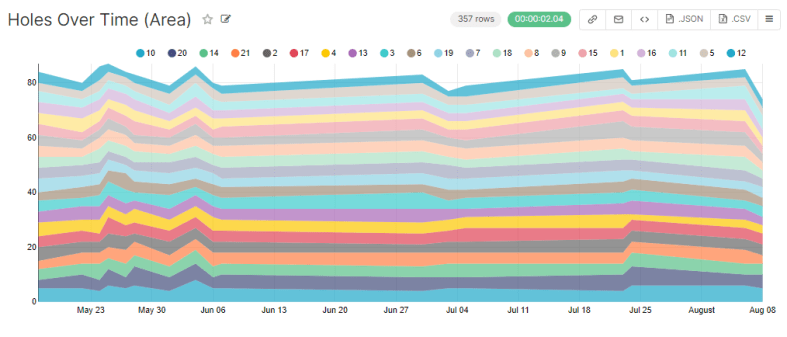
While we’re at it, lets revisit the flashy area chart from last post, where the width of each stripe represents the number of throws taken on that hole:

This is flashy and colorful, but we’re more concerned with problematic holes. Lets change width from number of throws to number of throws over par.

Awesome. This shows about what you’d expect. An interesting thing to notice is that while I’ve gotten better at hole 1, I’ve actually gotten worse at 9 (pale orange).

This might be because 9 is heavily wooded and honestly kind of a crapshoot… but the trend seems a little too strong. Furthermore, I changed my strategy probably around early July. Instead of attempting to weave my disc through the woods, I started tomahawking it over the tree tops. The data says this strat may not be working. Neat.

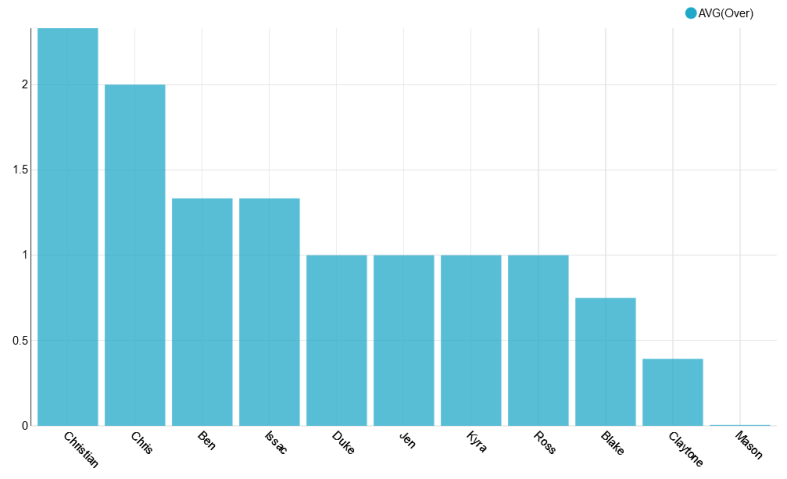
Last thing, lets make a leaderboard for completed games.

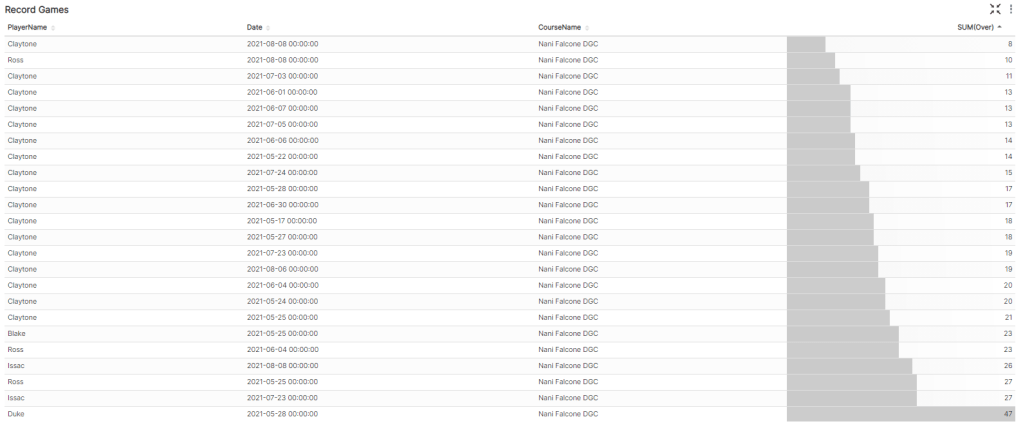
I play way more often than my friends, so the data might be skewed, aha.

Also shoutout to Duke for having the courage to play blue tees on his first game.

That’s all for now. Next time I’ll try to correlate hole length with average throws over par.

Until then, happy golfin’

Disc Golf Analytics: Pivoting UDisc Data

In my last post I talked about the process for importing UDisc data into Apache Superset for some advanced analytics. Unfortunately, with the data formatted as it was, I couldn’t get very meaningful insights.

Here’s the default layout for CSVs exported from the UDisc app.

Each row corresponds to a game. You’ll notice that there are some issues here.

  1. “Par” is listed as a player and must always be filtered out.
  2. “Total” corresponds to the total number of throws in a game. This isn’t useful because it is common to not play all 21 holes.
  3. “+/-” is a terrible name for a column, and refers to the number of throws over/under par for that game. This is not useful because, again, it doesn’t take incomplete games into account.
  4. Each hole has its own column. This means comparing them (for example, finding one’s weakest hole) requires a really large IF statement.

To solve these issues, I wrote a simple query to transpose the table.

select "PlayerName", "CourseName", "LayoutName", "Date", "hole", "score", "Par", "score" - "Par" as "Over" from 
(
select "PlayerName", "CourseName", "LayoutName", "Date", 1 as hole, "Hole1" as score from "UDiscScorecards" union
select "PlayerName", "CourseName", "LayoutName", "Date", 2 as hole, "Hole2" as score from "UDiscScorecards" union
select "PlayerName", "CourseName", "LayoutName", "Date", 3 as hole, "Hole3" as score from "UDiscScorecards" union
select "PlayerName", "CourseName", "LayoutName", "Date", 4 as hole, "Hole4" as score from "UDiscScorecards" union
select "PlayerName", "CourseName", "LayoutName", "Date", 5 as hole, "Hole5" as score from "UDiscScorecards" union
select "PlayerName", "CourseName", "LayoutName", "Date", 6 as hole, "Hole6" as score from "UDiscScorecards" union
select "PlayerName", "CourseName", "LayoutName", "Date", 7 as hole, "Hole7" as score from "UDiscScorecards" union
select "PlayerName", "CourseName", "LayoutName", "Date", 8 as hole, "Hole8" as score from "UDiscScorecards" union
select "PlayerName", "CourseName", "LayoutName", "Date", 9 as hole, "Hole9" as score from "UDiscScorecards" union
select "PlayerName", "CourseName", "LayoutName", "Date", 10 as hole, "Hole10" as score from "UDiscScorecards" union
select "PlayerName", "CourseName", "LayoutName", "Date", 11 as hole, "Hole11" as score from "UDiscScorecards" union
select "PlayerName", "CourseName", "LayoutName", "Date", 12 as hole, "Hole12" as score from "UDiscScorecards" union
select "PlayerName", "CourseName", "LayoutName", "Date", 13 as hole, "Hole13" as score from "UDiscScorecards" union
select "PlayerName", "CourseName", "LayoutName", "Date", 14 as hole, "Hole14" as score from "UDiscScorecards" union
select "PlayerName", "CourseName", "LayoutName", "Date", 15 as hole, "Hole15" as score from "UDiscScorecards" union
select "PlayerName", "CourseName", "LayoutName", "Date", 16 as hole, "Hole16" as score from "UDiscScorecards" union
select "PlayerName", "CourseName", "LayoutName", "Date", 17 as hole, "Hole17" as score from "UDiscScorecards" union
select "PlayerName", "CourseName", "LayoutName", "Date", 18 as hole, "Hole18" as score from "UDiscScorecards" union
select "PlayerName", "CourseName", "LayoutName", "Date", 19 as hole, "Hole19" as score from "UDiscScorecards" union
select "PlayerName", "CourseName", "LayoutName", "Date", 20 as hole, "Hole20" as score from "UDiscScorecards" union
select "PlayerName", "CourseName", "LayoutName", "Date", 21 as hole, "Hole21" as score from "UDiscScorecards" 
) cards left JOIN 
( select * from "CoursePars" ) pars
on "cards"."hole" = "pars"."Hole"
and "cards"."CourseName" like "pars"."Course"
where "score" <> 0 and
"PlayerName" <> 'Par'

This shapes the data like so:

Now each row corresponds to a hole. Lets break it down.

  1. Removing Par is easy enough, we must simply add the clause “PlayerName” <> ‘Par’
  2. Total is now removed. If it is required, it can easily be calculated by summing “Score” and grouping on “PlayerName” and “Date”
  3. In order to calculate over/under (formerly known as “+/-“) I created another table that could be joined to this one, titled “CoursePars”. After joining, we do “score” – “Par” and report that as “Over”.
    “CoursePars” looks like this:

4. By transposing the hole data and making it numeric, it’s now much easier to draw comparisons between holes. In the future, I’ll even append “Length” to the holes to illustrate how distance changes a hole’s difficulty.

Finally, for the fun stuff.

The most obvious metric is finding the holes I have the most trouble with, and the first few are honestly not that surprising.

Coming in first at a whopping 1.28 average throws over par is the bane of my existence, hole 10. This bad boy is one of the longest on the course at 474 feet, which doesn’t even account for the sharp left turn at about 300 feet. Trying to cut the corner (or accidentally putting it left) leaves you in thick, unforgiving brush.

The next few aren’t surprising either: baskets on unforgiving hill sides, across overgrown creeks, and through thick forests.

I’d like to experiment with weirder vizzes like the following Nightingale-Rose chart, but the “angle” axis is locked so that it can only be used with temporal fields for some reason. The flexibility of charts seems to be a key advantage that Tableau holds over Superset.

As such, this chart is not useful at all, but is nonetheless very cool looking.

Here’s a much more useful version, showing average throws per hole using area under lines.

A key downfall of this chart, however, is that it isn’t normalized for full games. This is really obvious with the dive on the June 8th game where I was only able to play 6 holes because it started raining.

Next time I’ll add hole length stats to see how it impacts difficulty, and also create a calculation to indicate completed versus partial games.

Til then, happy golfin’

Advanced Analytics for Disc Golf: Baby’s First Superset

What’s more fun than having a hobby? 

Using technology to take the fun out of that hobby, of course.

A few months ago I got into disc golfing, which is similar to regular golf, but actually enjoyable. Jokes aside, you toss frisbees at baskets, usually hundreds of feet away. The app UDisc allows players to track and post their scores, as well as download their scorecards as CSV data. This opens the door for analytics shenanigans.

At work, one of my main tools is the data visualization software Tableau. Think of it like Excel’s charting system, but far more advanced. However, Tableau is no longer offering personal licenses, and business licenses start at several hundred USD. Thankfully, there is an open source alternative that runs entirely in a Docker container hooked up to a web interface. Enter Apache Superset. 

Installing and configuring Superset was a breeze:

$ git clone https://github.com/apache/superset.git

$ cd superset

$ docker-compose -f docker-compose-non-dev.yml up

Unfortunately, I wasn’t able to get the Google Sheets driver to work with it. From cruising their issue tracker on GitHub, it looks like the functionality is dubious at best. Oh well, I’ve got other routes for getting the data into the system.

The Data -> Upload a CSV button doesn’t quite work the way you think; you’ll first need to prepare a database to receive the CSV. I actually wasn’t able to figure out how to set up a new database, but it probably has something to do with the fact that Docker closes all unspecified ports. 

Regardless, the easiest solution was to go to Data -> Databases, then edit the example database. I set the name to “local” and used the “Advanced -> Security” tab to enable CSV uploads. 

Once a database is set up to receive it, you can use the “Upload a CSV” menu item to do the thing. Neat.

I had quite a few bumps while attempting to figure out the basics. I’ve written loads of SQL, HiveQL and Tableau QL for work. However, this was my first time in PostgreSQL and there was a bit of a learning curve. For starters, whose brilliant idea was it to refer to column names using double quotes instead of backticks, single quotes, or even brackets???

But, I digress. With a little copy/paste magic I was able to get my first viz put together: the total number of throws per game, per player, arranged over time:

Unfortunately, since unplayed holes are marked 0 instead of null, this chart is not useful at all. We actually play all 21 holes less than half the time. For the chart, I can do a lot better. 

For my next experiment, I created another CSV with the par value for each of the 21 holes, and full joined it to the scorecard data so that I could count the strokes over/under par for each hole. For example, a bogey would have a value of 1, and a birdie would have a value of -1. Then I filtered out holes with a value of -1*par because they were unplayed. 

It allowed me to create this little viz: the average throws over par for the first hole on the course:

This is cute, but is a lot of work and requires a pretty verbose query. And since I don’t want to manually create a chart for every hole, we’re going to need to pivot the scorecard data. In 5 minutes I could write a script to do it, but the goal of this project is learning, so tomorrow I’ll attempt to do the pivot all in PostgreSQL.

Until then, happy coding.