In my last post I talked about the process for importing UDisc data into Apache Superset for some advanced analytics. Unfortunately, with the data formatted as it was, I couldn’t get very meaningful insights.
Here’s the default layout for CSVs exported from the UDisc app.

Each row corresponds to a game. You’ll notice that there are some issues here.
- “Par” is listed as a player and must always be filtered out.
- “Total” corresponds to the total number of throws in a game. This isn’t useful because it is common to not play all 21 holes.
- “+/-” is a terrible name for a column, and refers to the number of throws over/under par for that game. This is not useful because, again, it doesn’t take incomplete games into account.
- Each hole has its own column. This means comparing them (for example, finding one’s weakest hole) requires a really large IF statement.
To solve these issues, I wrote a simple query to transpose the table.
select "PlayerName", "CourseName", "LayoutName", "Date", "hole", "score", "Par", "score" - "Par" as "Over" from
(
select "PlayerName", "CourseName", "LayoutName", "Date", 1 as hole, "Hole1" as score from "UDiscScorecards" union
select "PlayerName", "CourseName", "LayoutName", "Date", 2 as hole, "Hole2" as score from "UDiscScorecards" union
select "PlayerName", "CourseName", "LayoutName", "Date", 3 as hole, "Hole3" as score from "UDiscScorecards" union
select "PlayerName", "CourseName", "LayoutName", "Date", 4 as hole, "Hole4" as score from "UDiscScorecards" union
select "PlayerName", "CourseName", "LayoutName", "Date", 5 as hole, "Hole5" as score from "UDiscScorecards" union
select "PlayerName", "CourseName", "LayoutName", "Date", 6 as hole, "Hole6" as score from "UDiscScorecards" union
select "PlayerName", "CourseName", "LayoutName", "Date", 7 as hole, "Hole7" as score from "UDiscScorecards" union
select "PlayerName", "CourseName", "LayoutName", "Date", 8 as hole, "Hole8" as score from "UDiscScorecards" union
select "PlayerName", "CourseName", "LayoutName", "Date", 9 as hole, "Hole9" as score from "UDiscScorecards" union
select "PlayerName", "CourseName", "LayoutName", "Date", 10 as hole, "Hole10" as score from "UDiscScorecards" union
select "PlayerName", "CourseName", "LayoutName", "Date", 11 as hole, "Hole11" as score from "UDiscScorecards" union
select "PlayerName", "CourseName", "LayoutName", "Date", 12 as hole, "Hole12" as score from "UDiscScorecards" union
select "PlayerName", "CourseName", "LayoutName", "Date", 13 as hole, "Hole13" as score from "UDiscScorecards" union
select "PlayerName", "CourseName", "LayoutName", "Date", 14 as hole, "Hole14" as score from "UDiscScorecards" union
select "PlayerName", "CourseName", "LayoutName", "Date", 15 as hole, "Hole15" as score from "UDiscScorecards" union
select "PlayerName", "CourseName", "LayoutName", "Date", 16 as hole, "Hole16" as score from "UDiscScorecards" union
select "PlayerName", "CourseName", "LayoutName", "Date", 17 as hole, "Hole17" as score from "UDiscScorecards" union
select "PlayerName", "CourseName", "LayoutName", "Date", 18 as hole, "Hole18" as score from "UDiscScorecards" union
select "PlayerName", "CourseName", "LayoutName", "Date", 19 as hole, "Hole19" as score from "UDiscScorecards" union
select "PlayerName", "CourseName", "LayoutName", "Date", 20 as hole, "Hole20" as score from "UDiscScorecards" union
select "PlayerName", "CourseName", "LayoutName", "Date", 21 as hole, "Hole21" as score from "UDiscScorecards"
) cards left JOIN
( select * from "CoursePars" ) pars
on "cards"."hole" = "pars"."Hole"
and "cards"."CourseName" like "pars"."Course"
where "score" <> 0 and
"PlayerName" <> 'Par'
This shapes the data like so:
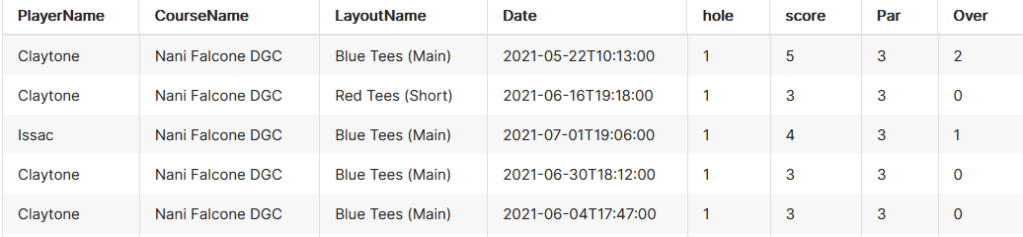
Now each row corresponds to a hole. Lets break it down.
- Removing Par is easy enough, we must simply add the clause “PlayerName” <> ‘Par’
- Total is now removed. If it is required, it can easily be calculated by summing “Score” and grouping on “PlayerName” and “Date”
- In order to calculate over/under (formerly known as “+/-“) I created another table that could be joined to this one, titled “CoursePars”. After joining, we do “score” – “Par” and report that as “Over”.
“CoursePars” looks like this:
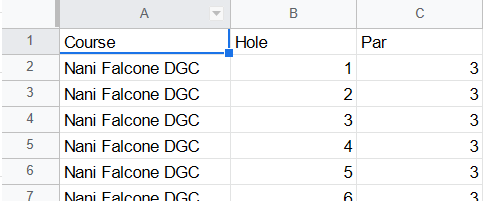
4. By transposing the hole data and making it numeric, it’s now much easier to draw comparisons between holes. In the future, I’ll even append “Length” to the holes to illustrate how distance changes a hole’s difficulty.
Finally, for the fun stuff.
The most obvious metric is finding the holes I have the most trouble with, and the first few are honestly not that surprising.

Coming in first at a whopping 1.28 average throws over par is the bane of my existence, hole 10. This bad boy is one of the longest on the course at 474 feet, which doesn’t even account for the sharp left turn at about 300 feet. Trying to cut the corner (or accidentally putting it left) leaves you in thick, unforgiving brush.

The next few aren’t surprising either: baskets on unforgiving hill sides, across overgrown creeks, and through thick forests.
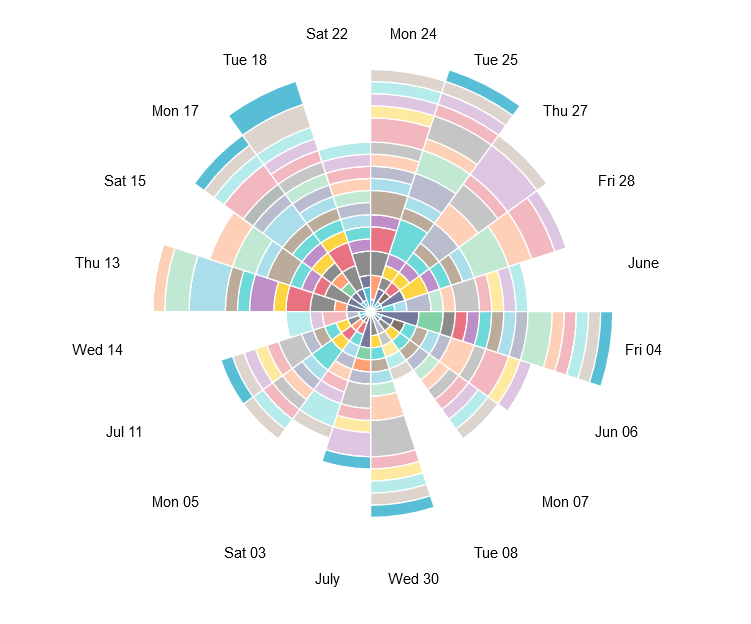
I’d like to experiment with weirder vizzes like the following Nightingale-Rose chart, but the “angle” axis is locked so that it can only be used with temporal fields for some reason. The flexibility of charts seems to be a key advantage that Tableau holds over Superset.
As such, this chart is not useful at all, but is nonetheless very cool looking.
Here’s a much more useful version, showing average throws per hole using area under lines.
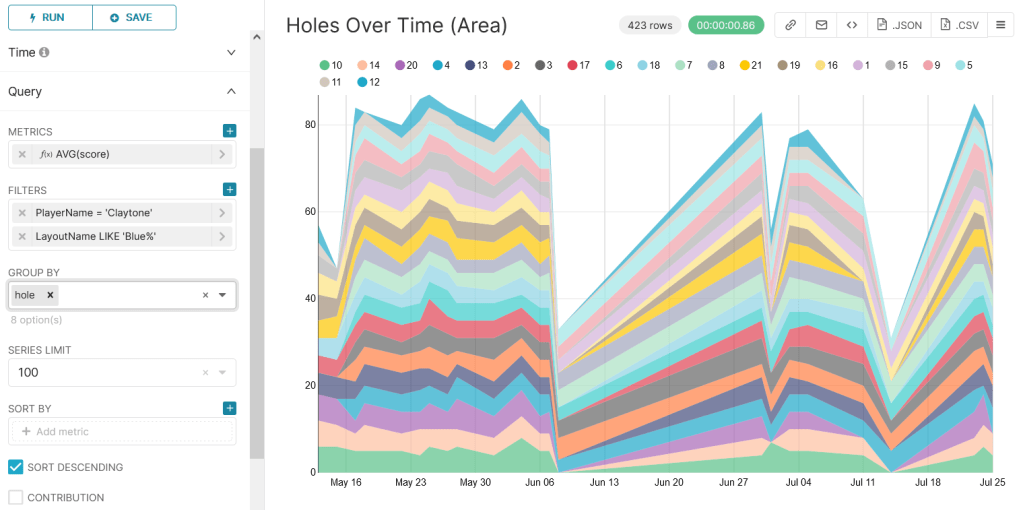
A key downfall of this chart, however, is that it isn’t normalized for full games. This is really obvious with the dive on the June 8th game where I was only able to play 6 holes because it started raining.
Next time I’ll add hole length stats to see how it impacts difficulty, and also create a calculation to indicate completed versus partial games.
Til then, happy golfin’
