What’s more fun than having a hobby?
Using technology to take the fun out of that hobby, of course.
A few months ago I got into disc golfing, which is similar to regular golf, but actually enjoyable. Jokes aside, you toss frisbees at baskets, usually hundreds of feet away. The app UDisc allows players to track and post their scores, as well as download their scorecards as CSV data. This opens the door for analytics shenanigans.
At work, one of my main tools is the data visualization software Tableau. Think of it like Excel’s charting system, but far more advanced. However, Tableau is no longer offering personal licenses, and business licenses start at several hundred USD. Thankfully, there is an open source alternative that runs entirely in a Docker container hooked up to a web interface. Enter Apache Superset.
Installing and configuring Superset was a breeze:
$ git clone https://github.com/apache/superset.git
$ cd superset
$ docker-compose -f docker-compose-non-dev.yml up
Unfortunately, I wasn’t able to get the Google Sheets driver to work with it. From cruising their issue tracker on GitHub, it looks like the functionality is dubious at best. Oh well, I’ve got other routes for getting the data into the system.
The Data -> Upload a CSV button doesn’t quite work the way you think; you’ll first need to prepare a database to receive the CSV. I actually wasn’t able to figure out how to set up a new database, but it probably has something to do with the fact that Docker closes all unspecified ports.
Regardless, the easiest solution was to go to Data -> Databases, then edit the example database. I set the name to “local” and used the “Advanced -> Security” tab to enable CSV uploads.
Once a database is set up to receive it, you can use the “Upload a CSV” menu item to do the thing. Neat.

I had quite a few bumps while attempting to figure out the basics. I’ve written loads of SQL, HiveQL and Tableau QL for work. However, this was my first time in PostgreSQL and there was a bit of a learning curve. For starters, whose brilliant idea was it to refer to column names using double quotes instead of backticks, single quotes, or even brackets???
But, I digress. With a little copy/paste magic I was able to get my first viz put together: the total number of throws per game, per player, arranged over time:
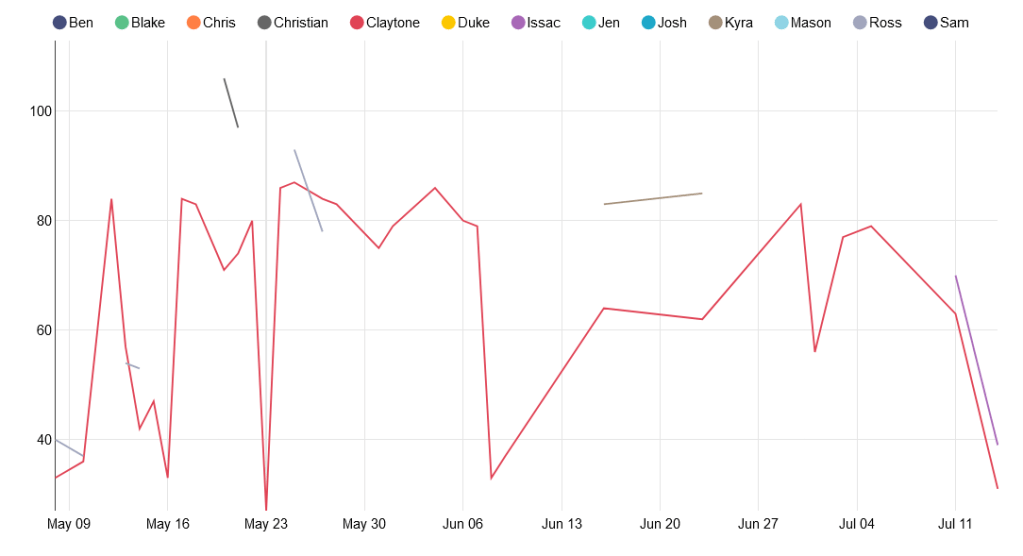
Unfortunately, since unplayed holes are marked 0 instead of null, this chart is not useful at all. We actually play all 21 holes less than half the time. For the chart, I can do a lot better.
For my next experiment, I created another CSV with the par value for each of the 21 holes, and full joined it to the scorecard data so that I could count the strokes over/under par for each hole. For example, a bogey would have a value of 1, and a birdie would have a value of -1. Then I filtered out holes with a value of -1*par because they were unplayed.
It allowed me to create this little viz: the average throws over par for the first hole on the course:

This is cute, but is a lot of work and requires a pretty verbose query. And since I don’t want to manually create a chart for every hole, we’re going to need to pivot the scorecard data. In 5 minutes I could write a script to do it, but the goal of this project is learning, so tomorrow I’ll attempt to do the pivot all in PostgreSQL.
Until then, happy coding.
